Julius AI and Rows AI set out to fix the same frustration. Spreadsheet work is slow, formula heavy, and easy to get wrong, and most people doing it are not data analysts. The two tools attack that problem from opposite ends. Julius pulls you out of the grid and lets you talk to your data the way you would brief an analyst. Rows kept you inside a spreadsheet and wired the AI straight into the cells. This piece walks through how each one performs on the work people actually care about, and which one earns a place in your week.
One fact shapes everything below, so it is worth saying before anything else.
Heads up: Rows has been shut down On 22 February 2026, Rows announced it had been acquired by Superhuman (the company formerly known as Grammarly). The standalone Rows product fully wound down on 31 May 2026, and its team and technology have moved into Coda inside the Superhuman suite. So Rows is no longer something you can sign up for today. That does not make the comparison pointless. Julius and Rows represent two genuinely different ideas about how AI should meet a spreadsheet, and that contrast is worth understanding. What follows judges both on the merits, then gives a practical verdict for anyone choosing right now. |
The bottom line up front • Pick Julius AI if your real need is analysis and answers, statistical tests, forecasts and ad hoc questions across messy files, with clean charts and a written explanation. It is also the only one of the two still available. • You would have picked Rows AI if your output is a living spreadsheet or dashboard that pulls live data and refreshes itself, with a team editing in a familiar grid. Strong model, but the product is gone. • Want the Rows experience now? Its team folded into Coda, so that is the most direct continuation. For a spreadsheet-native, live-data setup you can also look at Coefficient, Equals, or Row Zero for very large data. |
Same goal, opposite playbooks
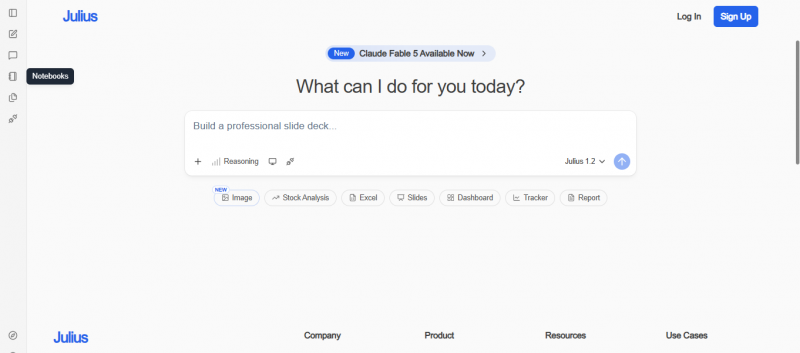
Julius started life as a simple chat-with-your-data tool and grew into a fuller platform: reusable Notebooks, direct database connectors, team features, and a Models Lab for trying different AI models. It has passed two million users and shows up inside companies like Nvidia, Zapier and Toast. Under the hood it writes and runs Python, R or SQL, which you can inspect or export if you want to check its working.
Rows began in 2017 in Porto and reached around 2.2 million users over nine years. It looked and felt like a modern Google Sheets, then added native AI functions, an in-grid AI Analyst, and more than fifty live data integrations. Across its life people ran over 17 billion spreadsheet functions and more than 800,000 AI Analyst prompts on it.

The difference is philosophical. Julius treats the spreadsheet as a starting point you leave behind, and the interface is a conversation. Rows treated the spreadsheet as the destination and brought the AI to it. The two paths look like this.
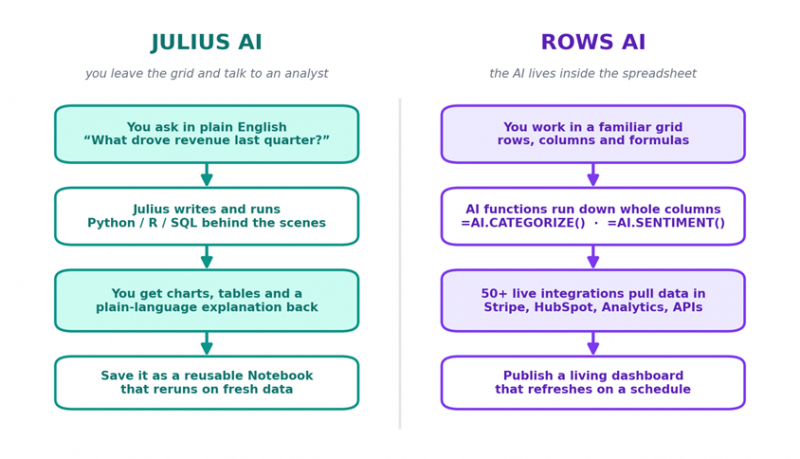
Two routes to the same goal: Julius turns data work into a conversation, while Rows kept it inside the grid.
QUICK FACTS
| At a glance | Julius AI | Rows AI |
|---|---|---|
| What it is | Conversational AI data analyst | AI-native cloud spreadsheet |
| Born | Chat-with-data tool, now a data platform | 2017, Porto, Portugal |
| Core idea | Leave the grid, ask in plain English | Stay in the grid, put AI in the cells |
| Best at | Statistics, forecasts, explained charts | Live dashboards, integrations, editing |
| Data in | CSV, Excel, PDF, Sheets, databases | 50+ live integrations, files, web pages |
| Output | Charts plus written analysis | Shareable, self-refreshing dashboards |
| Free tier | ~15 messages a month (a preview) | ~5 AI tasks a month (a preview) |
| Entry price | ~$20 / month | ~$8 / user / month |
| Status today | Live and available | Shut down 31 May 2026 |
Figures are approximate and described more fully in the notes at the end.
The shape of each tool
Score the two across seven things that matter for spreadsheet work and the shapes barely overlap. Julius stretches toward analysis, statistics and visualization. Rows reaches toward live integrations, grid editing and automation. Neither shape is better in the abstract. They are built for different jobs, which is exactly why the right choice depends on yours.
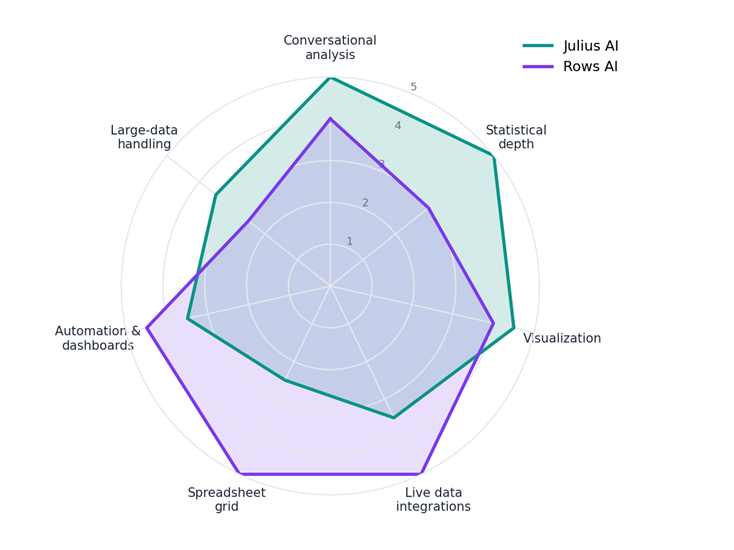
Higher is stronger on each axis. Scores are editorial, on a 1 to 5 scale.
ROUND 01 · ANALYSIS
Getting an answer out of raw data
Julius is built for the question “what is actually going on in this data.” Upload a file or connect a database, ask in plain English, and it writes the code, runs it, returns the result, and explains it, often flagging statistical significance and caveats along the way. It is comfortable with correlations, pivots, regressions, forecasts and even basic machine learning, which is well past what a spreadsheet does without pain. Rows could answer questions too, through its in-grid AI Analyst, and for summarizing a table or spotting a trend it was genuinely handy. But it stayed near spreadsheet-grade analysis. It was not trying to run an ANOVA for you.
Edge: Julius. For analytical depth and plain-language interpretation, the conversation-first analyst wins clearly.
ROUND 02 · OUTPUT
Charts, reports, and what you hand over
Julius auto-picks sensible chart types. Time series become line charts, categories become bars, and the visuals are clean, interactive and exportable as PNG or SVG. The thing you walk away with is a report: charts plus written findings you can drop into a deck or a doc. Rows made charts too, but its signature output was different and, for teams, arguably more powerful. It published a shareable dashboard that anyone could open in a browser without an account, refreshing on its own. The two aimed at different end products. Julius hands you an answer. Rows handed you a living report.
Edge: It depends. Julius for one-off analysis and presentation-ready charts; Rows for dashboards that keep themselves current.
ROUND 03 · DATA IN
Live data and integrations
This was Rows territory. More than fifty native integrations pulled numbers straight from Stripe, HubSpot, Google Analytics, ad platforms, databases and even plain web pages, so a report could refresh without a single manual export. Julius leans the other way. You mostly upload files, and live database connectors for Postgres, Snowflake and BigQuery show up only on its higher tiers. For continuously pulling fresh data from the tools a business already runs on, Rows was simply built for the job.
Edge: Rows. Broad, native, live integrations were a core strength and a clear win.
ROUND 04 · THE GRID
Living in a spreadsheet
If your team thinks in cells, formulas and shared tabs, Rows fit like a glove. It behaved like a modern spreadsheet with real-time co-editing, comments and a gentle learning curve, and its AI dragged down a whole column the way a formula would. Julius is not a grid at all. You can see and adjust your data, but you do not sit and edit a sheet, and collaboration means sharing results rather than editing together live. For spreadsheet-shaped work and group editing, Rows was the natural home.
Edge: Rows. It is a spreadsheet; Julius is an analyst that reads your spreadsheet.
ROUND 05 · SCALE
Big data and messy data
Neither tool loves very large datasets. Julius can slow down or hit limits past roughly a hundred thousand rows, and its generated code occasionally needs a fix or misreads unclean column headers. Rows was repeatedly flagged for performance dips on bigger datasets and for thin documentation when you reached an edge case. Julius edges ahead because its compute scales with the plan, with more memory on higher tiers, and because statistical work on a sample is its home turf. Even so, neither is a substitute for a true warehouse-backed business intelligence stack.
Edge: Slight Julius. More analytical headroom, though both run into a ceiling.
ROUND 06 · COST
Price and access
On the way in, Rows looked cheaper. Its Plus plan ran about eight dollars per user a month against roughly twenty for the Julius entry tier, and both free plans, about fifteen messages a month for Julius and about five AI tasks for Rows, were really just previews. Step up and the math flips depending on what you count. The Julius Pro tier sits near forty-five dollars per seat with unlimited messages and database connectors, while the Rows Pro plan was a flat fee near eighty dollars plus per-user pricing, aimed at heavy automation. The deciding factor, though, is not the sticker. Julius is on sale today. Rows is not.
Edge: Julius, by default. Rows had the cheaper door, but that door is now closed.
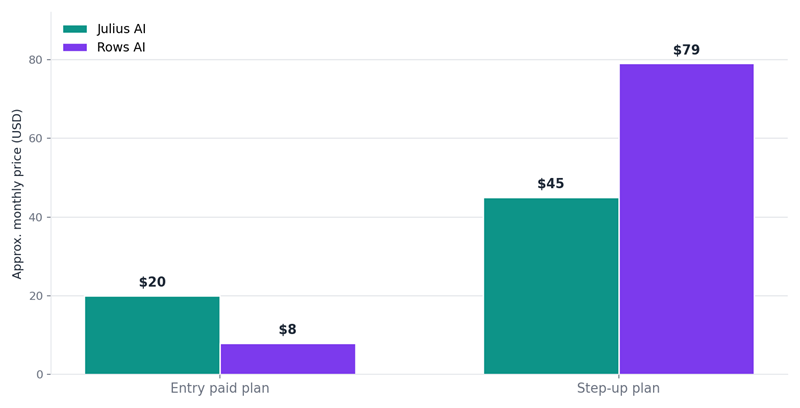
Approximate monthly prices. The step-up bars are not perfectly like-for-like: the Rows figure was a flat fee plus per-user pricing, while Julius is per seat.
| Plan tier | Julius AI | Rows AI (pre-shutdown) |
|---|---|---|
| Free | $0 · ~15 messages / month | $0 · ~5 AI tasks / month, 2 users |
| Entry paid | ~$20 / month | ~$8 / user / month |
| Step-up | ~$45 / seat · unlimited, DB connectors | ~$79 flat + per user · heavy automation |
| Higher tiers | Up to a few hundred / month | Enterprise (custom) |
| Discounts | ~15 to 20% annual, 50% students | ~25% annual (when active) |
Prices shift often. Treat these as ballpark and confirm current numbers on each product's own site.
The scorecard
Ten categories, each scored out of five. The Edge column shows who takes the point. The two split the board evenly on category wins, five each, but Julius edges the total once availability is counted.
| Category | Julius | Rows | Edge |
|---|---|---|---|
| Conversational ease | 5.0 | 4.0 | Julius |
| Statistical & analytical depth | 5.0 | 3.0 | Julius |
| Visualization quality | 4.5 | 4.0 | Julius |
| Live data integrations | 3.5 | 5.0 | Rows |
| Spreadsheet familiarity & editing | 2.5 | 5.0 | Rows |
| Automation & dashboards | 3.5 | 4.5 | Rows |
| Large-dataset handling | 3.5 | 2.5 | Julius |
| Collaboration | 3.0 | 4.5 | Rows |
| Price & value (entry) | 3.5 | 4.5 | Rows |
| Availability & longevity | 5.0 | 0.5 | Julius |
| Total (out of 50) | 39.0 | 37.5 | Julius, narrowly |
Here is the honest twist. Strip out the availability row and Rows actually finishes ahead on features, 37 to 34. That is the real story in one line: for spreadsheet-style, live-data work Rows was arguably the better tool, but it is the one you can no longer buy.
Pick the tool by what you actually do
Choose Julius AI if the work is analysis. You have a pile of data and real questions, you want statistics, forecasts and correlations, and you want clean charts plus a written read-out without building or maintaining a spreadsheet. It also wins by walkover on availability, since it is the only one of the two still here.
You would have reached for Rows AI if the work is a spreadsheet. Your output is a living grid or dashboard that pulls live data from tools like Stripe or HubSpot, refreshes on its own, and lets your team edit in a familiar layout. That model was excellent. The catch is simply that the product has been retired.
Replacing Rows today: its people and technology moved into Coda within the Superhuman suite, so Coda is the most direct path forward. If you want a spreadsheet-native, live-data setup specifically, Coefficient adds connectors and refresh to Excel or Google Sheets, Equals is a modern analyst-friendly spreadsheet, and Row Zero is built for very large datasets.
The honest final read Two tools, the same wish, opposite shapes. On capability they roughly split the board. Julius owns analysis, statistics and explanation; Rows owned the live, collaborative grid. The tie-breaker is not subtle: Rows wound down on 31 May 2026, so for anyone choosing today, Julius AI is both the stronger pure analyst and the only one still standing. If the spreadsheet-native, live-data way of working is what you are after, follow it into Coda rather than Rows itself. |
Post Comment
Share your thoughts about this article.
Be the first to post a comment!