New Relic is an all-in-one observability platform built to help teams maximize uptime and engineering performance across the software lifecycle. With a unified dashboard for application performance, infrastructure, logs, digital experience, and AI-driven intelligence, it enables faster root cause analysis and real-time optimization at scale.
Application Performance Monitoring
Custom alert policies on metrics like cart abandonment.
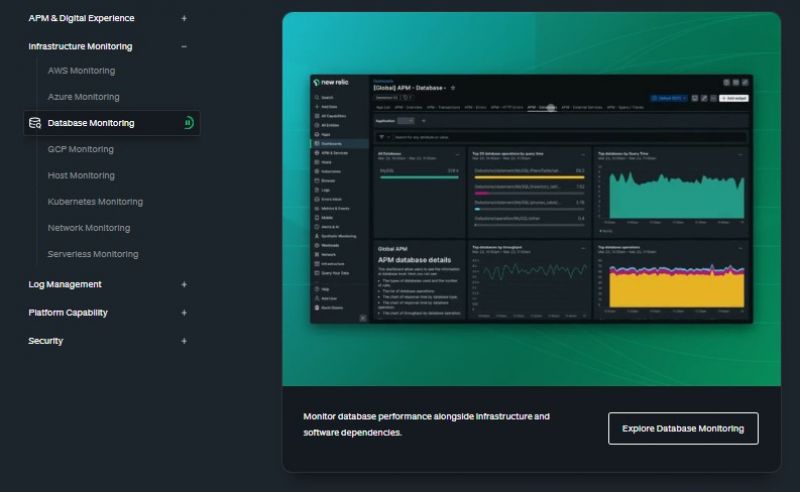
Monitors hybrid cloud, Kubernetes and legacy servers together.
CodeStream reveals issues inside the IDE.
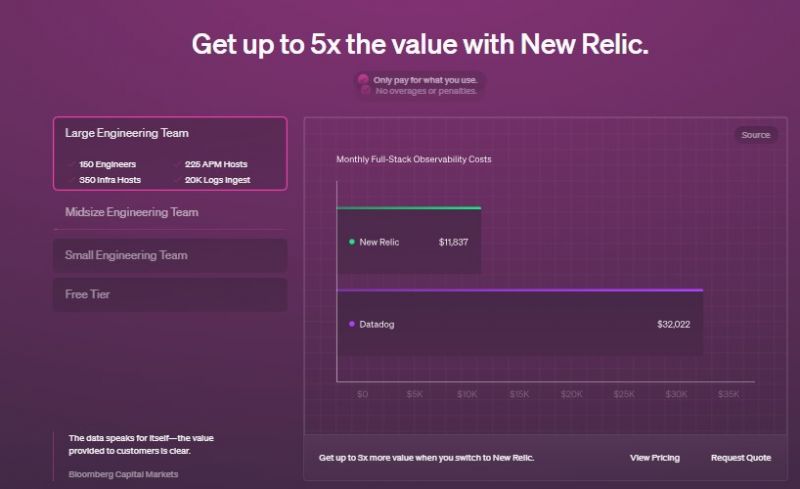
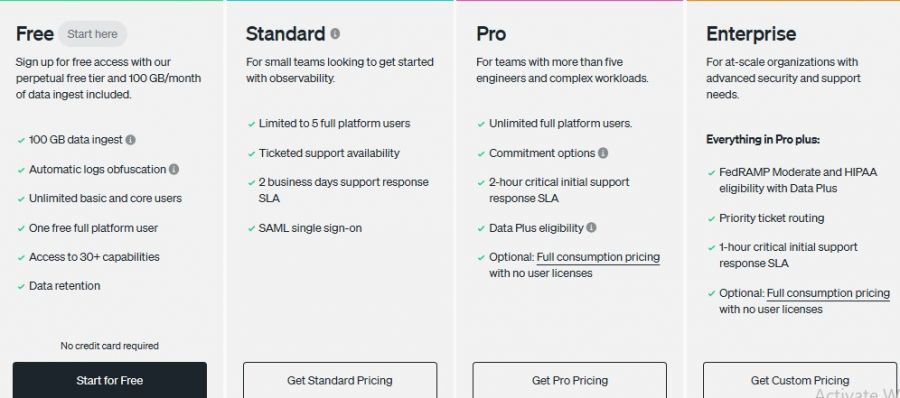
Generous free tier: 100GB ingest, unlimited basic users.
Real-time root cause analysis with unified dashboard.
UI lags with very large dashboards.
Browser replay feature may raise privacy concerns.
Cross-account sharing is manual via APIs.
*The price might have been changed, check the current pricing on the vendor's website.
Clients yet to be updated!
| Logo | Software Name | Rating | Reviews | Starting Price | Trial |
|---|---|---|---|---|---|
| PRTG Network Monitor | 4.1 | 51 | 179 USD ($) | 1-7 Days | |
| Plesk | 3.9 | 46 | 15 USD ($) | 0 Days | |
| cPanel | 3.9 | 43 | 26 USD ($) | 0 Days | |
| Lansweeper | 3.5 | 36 | 0 USD ($) | 0 Days | |
| Datadog | 3.5 | 54 | 0 USD ($) | 14 Days |
Complete Visibility, Smarter Decisions — Know Every Asset in Your IT, OT & IoT Stack.
Modern monitoring & analytics
Free network mapping software PRTG
Simplified WebOps and Web Hosting
A better way to work from solo creators to growing teams.
Auditing and compliance reporting