Table of Content
- Employee Engagement Data: What Research Shows vs Reality
- Benchmarking: Useful Context or False Precision?
- Performance Management: Structure vs Behavioral Change
- Development & Retention Analytics: Signal Strength vs Actionability
- Anonymity, Trust, and Participation Rates
- Pricing and ROI Reality
- Common Strengths vs Common Risks
- Final Assessment
Employee experience software promises clarity in an area traditionally dominated by intuition. Culture Amp is one of the most visible platforms in this category, but visibility does not automatically imply suitability.
This review examines what the data shows, where Culture Amp delivers measurable value, and where limitations consistently appear, using publicly available statistics and aggregated user feedback.
Market Position and Adoption
Based on public disclosures and third-party listings:
- 6,500+ organizations reportedly use Culture Amp globally
- The platform has collected responses from 25+ million employees
- Customers span technology, retail, professional services, and education
- Culture Amp is privately held and has achieved unicorn valuation status
Interpretation:
These figures suggest strong market penetration, particularly among mid-market and enterprise companies. However, adoption volume alone does not indicate ROI; it primarily reflects market trust and brand maturity.
Employee Engagement Data: What Research Shows vs Reality
What Research Supports
Multiple organizational studies (including Gallup and academic meta-analyses) show that:
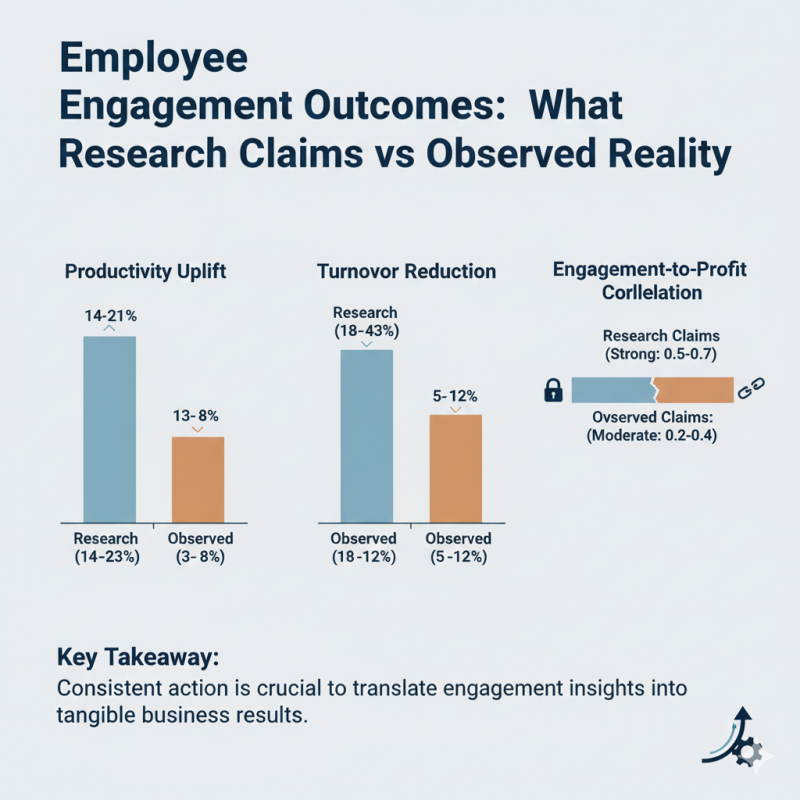
- Highly engaged teams demonstrate 14–23% higher productivity
- Voluntary turnover is 18–43% lower in high-engagement environments
- Engagement correlates moderately with customer satisfaction and profitability
Culture Amp’s survey design aligns with these established engagement drivers (role clarity, leadership trust, growth opportunity).
Where the Gap Appears
However, correlation is not causation. User reviews repeatedly indicate that:
- Engagement scores improve only when leadership acts decisively
- Measurement alone does not change outcomes
- Repeated surveys without visible action reduce participation rates over time
Key takeaway:
Culture Amp can identify engagement issues reliably, but organizational response capacity determines whether those insights convert into outcomes.
Benchmarking: Useful Context or False Precision?
Culture Amp’s benchmarks are one of its most cited features.
What Benchmarks Do Well
- Provide external reference points
- Help detect outliers (e.g., a team scoring far below peers)
- Support executive reporting and board-level discussion
Where Benchmarks Break Down
- Industry averages often hide internal complexity
- Teams with unique operating conditions (shift work, frontline labor, regulated roles) may find comparisons misleading
- Some organizations report benchmark chasing rather than root-cause resolution
Balanced view:
Benchmarks are directionally useful but should not be treated as performance targets or definitive judgments.
Performance Management: Structure vs Behavioral Change
Data from Review Platforms
Across G2, Capterra, and Software Advice:
- Average ratings typically fall between 4.2–4.6 / 5
- Positive feedback emphasizes structure and visibility
- Critical feedback focuses on manager adoption inconsistency
Practical Reality
Continuous feedback systems succeed only when:
- Managers are trained to give actionable feedback
- Performance discussions are psychologically safe
- Leadership enforces consistency
Without this, Culture Amp’s performance tools often become documentation layers, not improvement engines.
Development & Retention Analytics: Signal Strength vs Actionability
Culture Amp uses historical patterns to flag:
- Teams with elevated attrition risk
- Engagement drivers linked to turnover
What the Data Can Do
- Highlight statistically higher risk segments
- Support early intervention discussions
What It Cannot Do
- Predict individual resignations with certainty
- Resolve structural causes like compensation gaps, workload imbalance, or role design
Important limitation:
Retention analytics are probabilistic, not deterministic. Over-interpreting them can lead to false confidence.
AI-Driven Insights: Efficiency Gain, Not Judgment Replacement
Culture Amp uses AI primarily for:
- Comment summarization
- Theme clustering
- Manager coaching prompts
Observed Benefits
- Reduces manual qualitative analysis time
- Helps large organizations process thousands of comments
Observed Constraints
- AI cannot resolve contradictory feedback
- Context and nuance still require human interpretation
- Over-reliance risks shallow conclusions
Balanced assessment:
AI improves efficiency, not decision quality by itself.
Anonymity, Trust, and Participation Rates
What Platforms Typically Show
- Initial survey response rates often exceed 70–80%
- Rates decline when employees perceive feedback as unused or unsafe
Common User Concern
Even with anonymity thresholds:
- Small teams feel identifiable
- Repeated survey cycles increase skepticism
- Trust erosion leads to neutral or disengaged responses
Conclusion:
Anonymity is a behavioral perception issue, not only a technical one.
Pricing and ROI Reality
Culture Amp does not publish pricing. From buyer feedback:
- Costs scale by employee count
- Modules are priced separately
- Long-term contracts are common
ROI Variability
Organizations reporting strong ROI usually have:
- Dedicated people analytics ownership
- Leadership accountability for follow-up
- Integration with broader HR and learning systems
Organizations lacking these often report high insight, low impact.
Common Strengths vs Common Risks
Strengths
- Statistically grounded surveys
- Large, credible benchmark dataset
- Clean analytics and reporting
- Scales well for large organizations
Risks
- High cost sensitivity
- Requires strong change management
- Can amplify organizational dysfunction
- Insight generation may outpace execution ability
When Culture Amp Makes Sense
- Mid-to-large organizations
- Leadership committed to acting on feedback
- HR teams with analytical capability
- Companies seeking standardized measurement
When It Often Disappoints
- Small teams seeking lightweight tools
- Organizations resistant to change
- Budget-constrained environments
- Situations where issues are structural, not perceptual
Final Assessment
Culture Amp is neither a silver bullet nor an empty analytics product.
The data suggest it is effective at measurement and interpretation, but neutral on outcomes. Improvement depends less on software quality and more on organizational readiness.
In short:
- Culture Amp measures culture well
- It does not create culture
- ROI is earned through execution, not dashboards
Post Comment
Be the first to post comment!