Foot traffic data has become one of those phrases that sounds simple but hides a lot of complexity underneath. On the surface, it feels like counting people walking into a store. In practice, it’s about understanding movement, behavior, and patterns at scale.
Placer.ai is one of the platforms most often mentioned when this topic comes up in retail, real estate, and urban planning conversations. Not because it’s flashy, but because it has become a common reference point for location-based decision making.
This article walks through what Placer.ai really does, how people use it, where it performs well, where it has limitations, and whether it makes sense depending on your needs and budget.
No sales talk. Just how it works and why people care.
Understanding What Placer.ai Is Trying to Measure
At its core, Placer.ai focuses on how people interact with physical places. That sounds obvious, but most traditional tools only measure places as fixed points on a map. A store exists at an address. A mall sits inside a boundary. A city block has a defined perimeter.
Placer.ai treats locations differently. Instead of asking where a place is, it asks how people move around it.
Using anonymized mobile location signals, the platform observes:
- Where visitors come from
- How often they visit
- How long they stay
- Where they go before and after
- How behavior changes over time
This approach shifts the analysis away from assumptions and toward observed behavior. Rather than guessing a trade area based on distance, the platform builds it from real movement patterns.
Why Trade Areas Matter More Than Radius Maps
One of the most discussed features of Placer.ai is its approach to trade areas. Traditional location analysis often relies on simple distance rules, like a three-mile or five-mile radius. While easy to understand, those circles rarely reflect how people actually behave.
Placer.ai’s trade area modeling is based on where visitors truly originate. In practice, this often reveals patterns that feel unintuitive at first. A location might draw heavily from one direction but very little from another. A nearby competitor might share a significant portion of the same audience, even if it looks far away on a map.
For businesses and planners, this matters because decisions based on incorrect assumptions can be expensive. Leasing, staffing, marketing, and expansion strategies all depend on understanding who is realistically reachable.
How Businesses Use Placer.ai in Day-to-Day Decisions
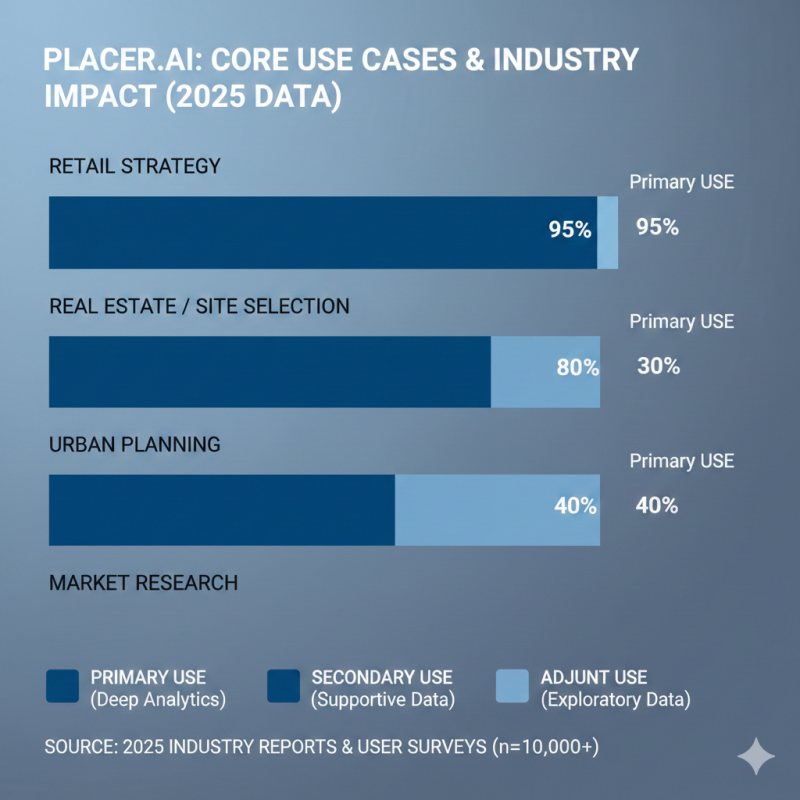
Placer.ai is rarely used for curiosity alone. Most organizations adopt it when they need evidence to support decisions that already carry financial or operational risk.
Retail Performance and Store Strategy
Retail teams often use the platform to understand whether a store is growing, plateauing, or declining in relevance. Foot traffic trends can reveal early signals before sales data makes the situation obvious.
Another common use is comparing locations against competitors. Rather than relying on anecdotal observations, teams can see overlap in visitor behavior and understand where competition is real versus assumed.
Store expansion decisions also show up frequently in user discussions. Placer.ai helps estimate whether opening a new location will attract new customers or simply redistribute existing ones.
Commercial Real Estate and Site Selection
In commercial real estate, traffic claims are common, but verification is harder. Placer.ai provides a way to support or challenge those claims with observed data.
Developers and brokers use it to analyze:
- Pedestrian and vehicle movement
- Time-based traffic fluctuations
- Comparisons between similar sites
- Long-term changes in area activity
In some cases, Placer.ai data has been used to reassess outdated municipal traffic estimates, particularly in rapidly developing areas.
City Planning and Public Sector Use
Urban planners and municipal agencies use Placer.ai to understand how public spaces are actually used. Parks, transit hubs, downtown corridors, and public events all generate movement patterns that are difficult to capture through surveys alone.
The value here isn’t precision at the individual level, but aggregated trends. When people show up, how long they stay, and whether usage is increasing or declining over time.
Because the data is anonymized and aggregated, it is generally positioned as observational rather than surveillance-based.
Demographics and Behavioral Profiles: Useful, but Not Perfect
Placer.ai also provides demographic and psychographic insights. These are derived from census data, modeled behavior, and observed patterns rather than direct personal identification.
This allows users to see trends such as income ranges, household types, or lifestyle clusters associated with a location’s visitors.
It’s important to treat these profiles as directional indicators, not precise identities. They help answer questions like:
- Is this location attracting families or singles?
- Are visitors more budget-focused or premium-oriented?
- How does this audience differ from nearby alternatives?
Used carefully, this data adds context. Used blindly, it can be misleading. Experienced users tend to cross-reference it with other datasets rather than treating it as absolute truth.
How Reliable Is the Data?
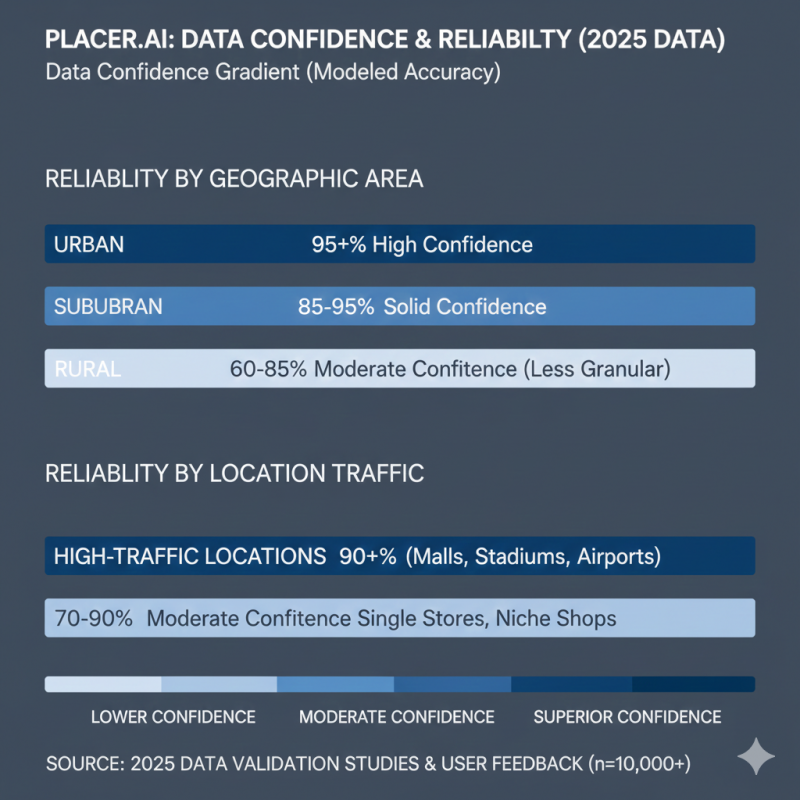
Reliability is one of the most debated aspects of any location intelligence platform.
In dense urban and suburban areas, Placer.ai’s data tends to be highly consistent and useful for trend analysis. Many enterprise users report strong alignment between traffic trends and internal performance metrics.
However, accuracy can vary in:
- Rural areas
- Low-traffic niche locations
- Very small venues
- Historical analysis goes far back in time
These limitations are not unique to Placer.ai. They stem from the realities of mobile data coverage and anonymization thresholds. Most experienced users account for this by focusing on relative changes rather than exact counts.
Is Placer.ai Free to Use?
Placer.ai offers a limited free experience that allows users to explore general trends for selected locations. This can be helpful for understanding the interface and seeing whether the data feels relevant to your market.
That said, most of the platform’s practical value sits behind paid plans. Advanced analysis, multiple locations, historical depth, and exports are all part of the professional and enterprise tiers.
In short, the free version helps you look around. It doesn’t replace a paid setup.
Pricing: What Users Actually Say
Placer.ai does not list fixed pricing publicly. Based on industry feedback and user discussions, pricing is typically structured as annual contracts and scales based on usage.
Factors that influence cost include:
- Number of locations tracked
- Number of users
- Depth of historical data
- Access to APIs or add-on datasets
For most organizations using Placer.ai seriously, costs fall into the five-figure annual range and can increase depending on scope. This places it firmly in the enterprise software category rather than small-business tooling.
Is Placer.ai a SaaS Platform?
Yes. Placer.ai is delivered as a cloud-based SaaS product. Users access it through a web dashboard, with optional integrations for teams that need data exports or API access.
There is no on-premise deployment, and updates are handled centrally by the company.
How Placer.ai Is Viewed as a Company
Public sentiment around Placer.ai is generally stable and positive, especially among enterprise users. Reviews often highlight data quality, interface clarity, and usefulness for real-world decisions.
Criticism tends to focus on:
- Cost barriers for smaller organizations
- Limited international coverage compared to some competitors
- Situations where data density is lower
The company appears to focus heavily on retail, real estate, and planning use cases rather than trying to serve every possible market.
How It Compares to Other Location Intelligence Tools
Placer.ai sits in a specific position within the broader location intelligence ecosystem.
Some platforms prioritize deep GIS customization but require technical expertise. Others focus on global coverage or logistics optimization. Placer.ai’s strength lies in making complex movement data understandable for business users without heavy configuration.
This makes it popular with teams that need insights quickly and consistently, even if it means giving up some customization flexibility.
Who Placer.ai Is (and Isn’t) Designed For
Placer.ai tends to work best for organizations that:
- Make frequent location-based decisions
- Operate multiple physical sites
- Need defensible data for high-stakes planning
- Can justify enterprise software investment
It is less suitable for:
- Small businesses looking for basic visitor counts
- One-time research needs
- Users seeking fully customizable GIS modeling
Final Thoughts
Placer.ai doesn’t try to predict the future. It doesn’t promise perfect accuracy. And it doesn’t simplify the complexity of human movement into neat formulas.
What it offers instead is a structured way to observe how people interact with physical spaces at scale. For some organizations, that insight becomes foundational. For others, it’s simply more than they need.
Understanding that distinction is usually the difference between finding Placer.ai valuable and finding it excessive.
Post Comment
Be the first to post comment!