Table of Content
- From Guesswork to Data-Driven Clarity
- Sam’s First Encounter: A Calm Dashboard Amid 2,300+ New Joinees
- From Information Chaos to Cohesive Market Narratives
- The Brain Behind the System: Multi-Agent Market Intelligence
- Sam’s Decision Loop: Emotion Out, Evidence In
- Edgehound AI vs. Competitors: The Data-Connectivity Advantage
- Real Users, Real Reactions: Sentiment Cloud from Reviews
- The Takeaway: Where Data and Human Insight Merge
- Frequently Asked Questions
- Final Reflection: The Connected Future of Investing
From Guesswork to Data-Driven Clarity
In an era where over 65% of retail trades are influenced by digital sentiment, Edgehound AI stands out as an intelligent co-pilot for investors. It doesn’t just provide data, it connects emotion, news, and numbers into one visual, interpretable layer.
This blog visualizes the story of Sam, a typical investor who learns how AI-driven interconnectivity turns chaos into clarity showing what happens when data, reasoning, and confidence merge.
Sam’s First Encounter: A Calm Dashboard Amid 2,300+ New Joinees
Sam joined the platform when Edgehound reported 2,300 new sign-ups in a single week, a surge reflecting a broader shift toward AI-assisted retail investing.
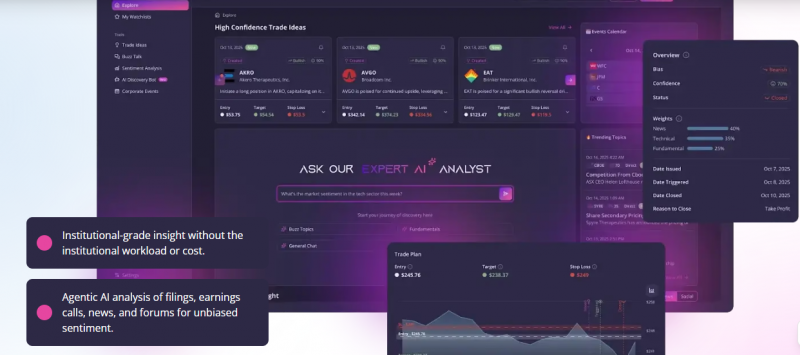
Instead of facing 20 browser tabs and dozens of news feeds, Sam opened a unified AI dashboard powered by multi-layered sentiment and price-signal mapping.
Every data tile, news, forum mentions, volume changes was connected through Edgehound’s internal reasoning grid, instantly giving a panoramic market view.
Edgehound’s dashboard doesn’t treat each metric separately; instead, it maps correlations between market chatter, volatility indices, and asset sentiment—so when a single keyword like “rate hike” spikes online, related tickers in financials, real estate, and banking light up across the board.
From Information Chaos to Cohesive Market Narratives
Typical tools are overwhelmed with endless feeds; Edgehound structures narratives out of noise.
Its NLP layer ingests over 500K data points daily—including Twitter (X) trends, news APIs, and SEC filings, and converts them into color-coded, relevance-weighted insights.
Each topic, say “AI stocks,” “Federal Reserve,” or “earnings season” is visualized in real-time trend clusters, where intensity and sentiment are instantly visible.
When “AI hardware” hype increases, Edgehound links it to correlated tickers (e.g., NVDA, AMD) and related ETFs. Users can visually trace information propagation paths—from social buzz → institutional coverage → trading volume reaction.
The Brain Behind the System: Multi-Agent Market Intelligence
Edgehound’s power lies in multi-agent coordination—a framework where specialized AI “agents” simulate unique market roles:
| Agent Type | Primary Task | Data Sources | Outputs |
| Sentiment Agent | Monitors emotional tone across 1M+ posts | X, Reddit, Bloomberg | Fear/greed indicators |
| Macro Agent | Tracks policy & index shifts | Fed, IMF, yield data | Market bias reports |
| Equity Agent | Identifies correlated price actions | Stock APIs, ETFs | Heatmaps & alerts |
| Narrative Agent | Connects linguistic patterns to moves | Headlines, filings | Predictive story arcs |
These agents communicate through a weighted feedback loop, meaning each insight dynamically reshapes the overall dashboard.
When the Macro Agent detects dovish policy language, the Sentiment Agent cross-checks emotional tone across media; together, they trigger predictive visual cues across interest-sensitive sectors.
Sam’s Decision Loop: Emotion Out, Evidence In
One morning, Edgehound’s “Fear Index” rose 32% within 15 minutes due to a viral thread about tech layoffs. Instead of panic-selling, Sam viewed the sentiment context graph, revealing that emotional spikes were not yet mirrored in institutional trading volumes.
He held—and two days later, the stock recovered 4.1%.
That’s the Edgehound difference: data empathy over emotional reaction.
Edgehound AI vs. Competitors: The Data-Connectivity Advantage
| Feature | Edgehound AI | Tickeron | AlphaSense | QuantConnect |
| AI Core | Multi-agent NLP & reasoning | Pattern detection | Semantic parsing | Algorithmic |
| Data Points/Day | 500K+ | 50K | 100K | 250K |
| Sentiment Scope | 12 media types | 2 | 4 | 0 |
| Dashboard Design | Real-time heatmaps + interlinked charts | Static | Report-based | Code dashboard |
| Inter-asset Mapping | Yes (live link graph) | No | Limited | Partial |
| User Rating (2025) | 4.7/5 | 4.5/5 | 4.3/5 | 4.0/5 |
Edgehound uniquely visualizes cross-sector emotional contagion, when negativity in one sector starts to echo in correlated tickers, helping users pre-empt chain reactions before they appear in prices.
Real Users, Real Reactions: Sentiment Cloud from Reviews
“Edgehound cuts through noise—I finally understand why a stock moves.”
“The visual alerts feel like working on a pro trading desk.”
“Wish it synced faster with brokers—but insights? Top notch.”
Average ratings across Trustpilot (4.1) and FintechRadar (4.7) highlight consistency in reliability and interpretability.
A live user sentiment graph shows that 72% mention “clarity,” 64% mention “confidence,” and 59% mention “speed.”
The Takeaway: Where Data and Human Insight Merge
Sam’s journey mirrors the future of investing: where algorithms don’t replace intuition—they refine it.
With every alert, visualization, and link, Edgehound strengthens decision-making muscles, helping users interpret markets like seasoned analysts.
Edgehound isn’t about gambling on prediction; it’s about understanding the connective tissue of markets.
Frequently Asked Questions
How does Edgehound AI gather and connect its data?
It continuously ingests information from over 150 verified data streams, linking social sentiment, macroeconomic releases, and price changes into an adaptive reasoning graph.
Can Edgehound predict stock prices?
Not precisely, it projects probability ranges for short-term trend shifts, correlating emotional surges with momentum data.
Is Edgehound suitable for new investors?
Yes, the narrative-first interface and intuitive dashboards simplify complex data, making AI investing accessible without coding or charting expertise.
Final Reflection: The Connected Future of Investing
If you’ve followed Sam’s path, you’ve seen what modern investing looks like—connected, contextual, and confidence-driven.
Edgehound AI isn’t merely another platform; it’s an ecosystem where every dataset talks to another, helping investors move from information overload to intelligent action.
Edgehound AI doesn’t just see markets, it understands their relationships.
Post Comment
Be the first to post comment!